
How to Add Charts to WordPress: Every Real Option, Honestly Compared
WordPress chart options range from native blocks to dedicated plugins, but most sites only need lightweight animated SVG charts that load on a single page without bloating their entire site.
Sooner or later, almost every WordPress site needs a chart. Maybe you are writing a post that compares two products, summarising survey results, showing a trend over time, or just trying to break up a wall of text with something a reader can actually look at. The good news is that WordPress gives you several ways to do this. The slightly annoying news is that nobody tells you which way is right for your situation, so people tend to grab the first option they find and live with the consequences.
This guide walks through the genuine options for getting charts into WordPress, what each one is good at, and where each one quietly costs you. By the end you should be able to pick the approach that fits your site rather than the one that fits a tutorial someone wrote for a completely different use case.
First, decide what kind of chart you actually need
Before you touch the editor, answer one question: does your chart need to change after you publish it? There is a real difference between a chart that shows a fixed set of numbers (a one-off comparison in an article) and a chart that has to reflect live data (a stats dashboard, a price tracker, a figure that updates from a spreadsheet).
If your data is fixed, you want the lightest, simplest method that looks good. If your data is live, you genuinely need a plugin that can connect to a source and re-render. Most bloggers and content sites fall firmly into the first camp, and they massively over-engineer it by reaching for a tool built for the second. Knowing which camp you are in saves you from installing something heavy you will never fully use.
Option 1: Native Gutenberg blocks
WordPress core does not ship a real chart block, but a few popular block libraries add one, and some table plugins can render a basic bar or pie chart from the data you type into a table block. For a simple, static comparison this can be enough. You type your numbers, pick a chart type, and you are done, all inside the editor you already use.
The tradeoff is that these blocks are usually basic by design. You get a handful of chart types, limited styling, and often a static image or a plain canvas with no motion. They are fine for a quick figure inside a post. They start to feel cramped the moment you want something that looks polished or animated, and a few of them load a charting library on every page just to support the one post that uses it.
Option 2: Page builder widgets (Elementor and WPBakery)
If you build pages with Elementor or WPBakery Page Builder, both ecosystems offer chart widgets, either built in or through an add-on pack. The appeal is obvious: you stay inside the drag-and-drop interface, you style the chart with the same controls you use for everything else, and it visually matches the rest of your layout.
The catch is lock-in and weight. A chart built as an Elementor widget lives inside Elementor. If you ever migrate away from that builder, the chart goes with it, and you rebuild from scratch. Page builders also tend to be heavy already, and bolting a charting add-on onto them adds more scripts to pages that are frequently the slowest on the whole site. If you are committed to your builder, widgets are convenient. Just go in with eyes open about portability and performance.
Option 3: A dedicated chart plugin
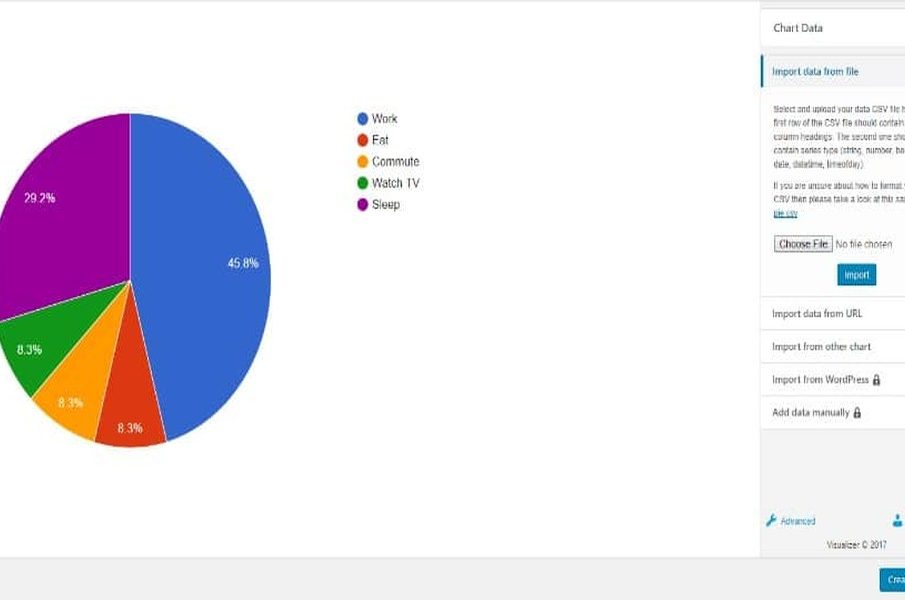
This is the route most people assume they need, and for some sites it genuinely is the right one. A real chart plugin gives you many chart types, data import from CSV or Google Sheets, scheduled updates, and sometimes interactive filtering for logged-in users. If you are running a data-heavy resource or a members area where figures update on their own, this power is the whole point.
For everyone else, it is worth being honest about the cost. Many chart plugins bundle a full JavaScript charting library, add an admin settings panel, and enqueue their scripts and styles across your entire site rather than only on the posts that contain a chart. That means your contact page downloads charting code it never uses. You also take on another plugin to keep updated, another potential conflict after a core release, and another line item on your security surface. None of that is a dealbreaker if you need the features. It is pure waste if you do not.
Option 4: Manual embeds
The fourth option is the one developers reach for and most bloggers forget exists: treat a chart like you treat a YouTube video or a tweet. You create the chart somewhere, you get a snippet of HTML, and you drop it into a Custom HTML block (or the Text tab in the Classic Editor). Nothing global gets enqueued, the chart only loads on the page that contains it, and because it is plain markup it survives WordPress updates without depending on a plugin author keeping pace.
The downside of raw manual embedding is purely ergonomic. You have to leave WordPress to make the chart, manage snippets by hand, and there is no nice picker inside your editor. For a one-off it is fine. For a site that publishes charts regularly, the back-and-forth gets old.
Where a lightweight animated-chart plugin fits
There is a sweet spot between the heavy do-everything plugin and the fiddly manual embed, and it is worth knowing about because it solves the common case cleanly. Some newer tools render charts as lightweight SVG (roughly twenty to thirty kilobytes each instead of a few hundred kilobytes of library code), defer-load them below the fold so they do not hurt your Core Web Vitals, and still give you an in-editor picker so you never leave WordPress.
> The short version: Lightweight animated SVG charts let you keep per-page file sizes low while adding visual polish that helps readers engage more deeply with your data.
That is the gap the free Scrollchart plugin is built for. It installs from the official directory the normal way (Plugins, Add New, search for it, activate) and then exposes the same catalogue picker, live preview, and colour controls through a Gutenberg block, a shortcode for the Classic Editor, a WPBakery element, and an Elementor widget. So whatever editor your site already uses, you get the convenience of a plugin without dragging a full charting runtime onto every page. The charts are responsive on mobile, follow light or dark theme automatically, and the animation paints the chart in as the reader scrolls to it, which tends to hold attention better than a static image does.
A simple way to choose
Strip it down to this. Need live, updating, interactive data? Install a full chart plugin and accept the weight, because you are using what you paid for. Just need clear, attractive, mostly static charts inside your articles, and you care about speed? Use native blocks for the bare minimum, a manual embed if you want maximum control, or a lightweight animated-chart plugin if you want the in-editor convenience without the bloat. The tools differ less in what they can draw and more in what they cost you to keep around. Pick the one whose cost matches what your site actually needs, and the charts will take care of themselves. If you want to see the range of diagrams available before committing, the wider catalogue on Scrollchart is free to browse and free to use commercially.
Frequently asked questions
What is the fastest way to add a chart to WordPress?
Native Gutenberg blocks or a lightweight animated SVG plugin are fastest because they load only on pages that need them. Avoid full charting libraries unless your data genuinely updates live, because they enqueue heavy JavaScript across your entire site even on pages with no charts.
Can I use Scrollchart charts without installing a plugin?
Yes. Scrollchart charts can be manually embedded as HTML snippets in a Custom HTML block, which gives you maximum control over placement and zero dependency on a plugin being kept updated. Many publishers prefer this approach for one-off charts inside articles.
Why do animated charts matter for engagement?
Animated charts draw the eye as readers scroll, holding attention better than static images and making data feel less like a block of information to skip. Scrollchart’s scroll-reveal animation paints charts in as they come into view, which research shows improves comprehension and time-on-page.